
Supported by Photoshop
CS2/CC and higher, Photoshop
Elements 11 and higher
Requirements: An image has to be opened.
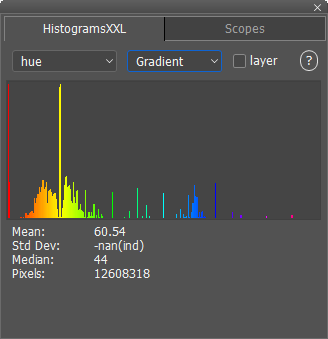
The HistogramsXXL panel is similar to the Histogram panel of Photoshop (Elements), but it offers 11 other histogram in addition to the six histograms of Photoshop (Elements). It draws histograms in 7 different styles compared to the single style of Photoshop (Elements). Additionally you can enlarge the panel window to view the histograms in full detail.
The first combo box at the top of the panel is for choosing the histogram type from "RGB Colors" to "Red/Green (Cr)". Histograms of the following five color models are supported: RGB, CMYK, HSL, Lab and YCbCr. Besides combined histograms of all channels of a color model, you can also view the histograms of individual channels. The second combo box is fileld with the seven styles with which the histogram is draw. These include: Filled (just like Photoshop), Filled/Line, Bars, Gradient, Gradient/Line, Line and Dots.
If the Layer check box is activated, only the histogram of the currently selected layer is displayed. Otherwise the histogram of all layers is shown. If a selection is created, your can only see the histogram of the image area, which is surrounded by the selection. To see the histogram of the whole image you have to remove the selection again. An exclamation mark symbol shows in the top right corner. Click it to use the full sized image to calculate the histograms. This is normally not done to avoid slowing down Photoshop (Elements).
Supported by Photoshop
CS2/CC and higher, Photoshop
Elements 11 and higher
Requirements: An image has to be opened.
 |
 |
 |
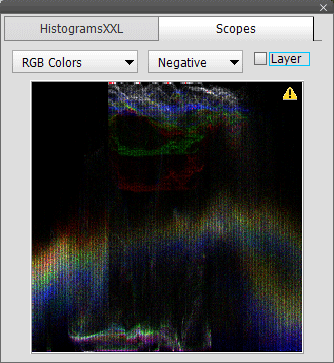
The Scopes panels shows 23 different types of scopes (first combo box) in a negative or positive style (second combo box). Only the RGB, CMYK, HSL and YCbCr color models are used for calculating the scopes. So there is no Lab scope available (see the HistogramsXXL panel), because it would be too time consuming and the YCbCr color model provides a very similar scope.
A scope is a type of 3D histogram, which is popular in video editing, but is also useful for image editing if you know how to read it. To display a scope a regular histogram is calculated for every vertical column of the image. The histogram of every vertical column is then displayed as a single vertical line in the scope from bottom to top (instead of left to right). To fit the histogram data into a one-dimensional vertical line the values of the histogram are expressed as grayscale values. So a dark pixel in the scope represents a low histogram value whereas a very bright pixel means a high histogram value.
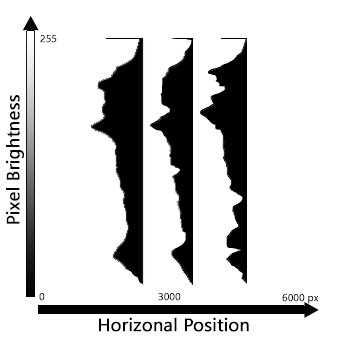
The bottom to top axis of a scope represents pixel values from 0 to 255 (0 to 32768 for 16-bit/channel images). So the pixel values with low brightnees are located at the bottom of the scope whereas the pixel values with high brightnees are displayed at the top. The brighter a pixel in the scope, the more pixels of that value exist in the image. So a dark spot at the bottom of the scope means that there are not many dark pixels in the image (at that horizontal position). A white spot at the bottom means that many dark pixels are located in the image (at that horizontal position). A white spot at the top means that many bright pixels are in the image (at that horizontal position). Consequentialy, a bright area in the middle of the vertical axis means that there are many middle gray pixel values in the image.
Going from left to right in the scope you see how the histograms change from the left to the right hand-side of the image. So if there is a spot horizontally in the middle of the scope, it also means that the histogram values are also physically located in the middle of the image. So the horizontal axis of the scope represents the physical location in the image from left to right. On the other hand, the vertical axis of the scope represents the pixel brightness in the image like the vertical axis of the normal histogram does.
For example, if there is a bright area in the middle of the scope, it means that there is a middle gray object in the middle of the image. If there is a black area in the right bottom of the scope, it means that there are no dark pixels at the right hand-side of the image. If there is a white area in the top left corner of the scope, it means there is a bright object at the left-hand side of the image.
Scopes that display a combination of channels (e.g. the R, G and B channels) at the same time, also contain colors where the vertical histograms of the three channels partially overlap. This indicates that the brightness levels of the color channels do not align completely. This can be used as a guide for color correction by making the scope patterns overlap thus making them appear more gray and less colored.
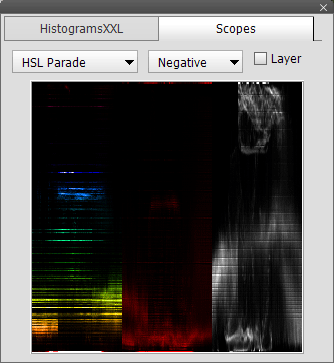
There are also parade-type scopes, which display the color channels one after the other from left to right. So for the RGB Parade scope the left third of the scope displays the R channel, the middle third displays the G channel and the right third shows the B channel. This also means that the full width of the image is only represented by 1/3 of the space of the scope.
The HSL scopes at the bottom of the first combo box list are again different: For example, the Saturation/Hue scope shows the saturation values vertically and the hue values horizontally. This lets you see the minimum and maximum saturation of different hues. The Lightness/Hue scope shows how dark or bright individual hues are in the image. Finally, the Saturation/Lightness scope displays the saturation range of dark to bright pixel values.
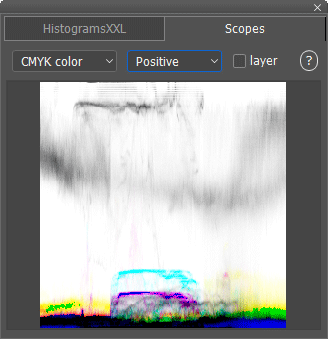
Again as with the HistogramsXXL panel you can activate the Layer check box in order to only see the scope of the current layer instead of the whole image. To see only the scope of a certain image area you can create a selection. An exclamation mark symbol appears in the top right corner. Click it to use the full sized image to calculate the scopes. This is normally not done to avoid slowing down Photoshop (Elements).